
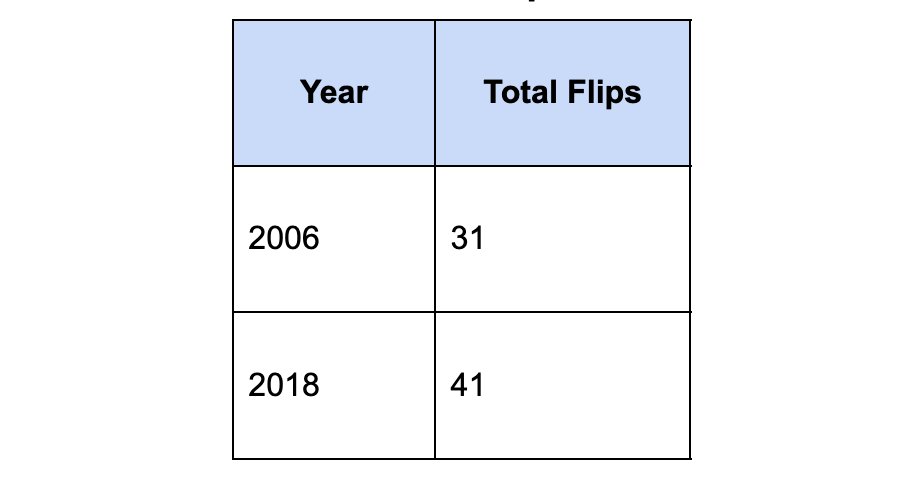
When I wrote Part 1 in August, I said 2026 was beginning to resemble 2006. Not because the issues are identical, but because the underlying conditions felt familiar. Since then, the intensity of those conditions has grown. We have lived through the longest government shutdown in American history. Federal workers were furloughed, and families were left scrambling. We had no clear sense of steady leadership. Health care has moved back into unstable territory. Enhanced Affordable Care Act subsidies are expiring, raising premiums for millions of families. At the same time, vaccine policy and public health messaging have become chaotic and incomprehensible. The growing influence of RFK Jr. in vaccine debates has injected confusion into a space that depends on clarity. When trust in public health institutions weakens, it shows up locally in schools, hospitals, and communities. Voters do not experience these developments as separate headlines. They feel the collective impact every day. Add ICE immigration enforcement controversies that cost American lives, concerns about the pardon process, questions about politicization inside the Justice Department, and open threats toward Greenland that have prompted NATO partners to conduct military exercises in response. None of these alone defines a midterm. Together, they create a broader sense that things are not steady. And historically, when instability stretches across multiple areas of governance, voters do not simply register dissatisfaction. They seek meaningful correction. That is when elections stop being routine adjustments and start becoming something larger. If you want to see what that looks like in practice, look at 2006. 2006 vs 2018Many people point to the Blue Wave of 2018 for historical precedent, and they have a point. There are many direct parallels—not the least of which is that we’re dealing with the same incumbent president. But that isn’t truly assessing the depth of the potential wave this year. Here is the surface comparison: Total Republican to Democratic House Flips
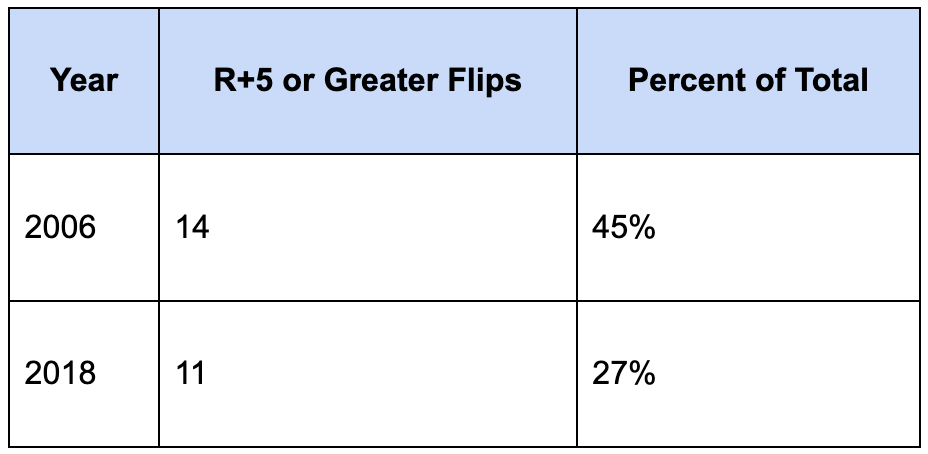
On raw numbers, 2018 looks larger, but that is not the real measure. The better question is how red those seats were before they flipped. Flips in Districts Leaning Republican by 5 Points or More
Nearly half of the seats Democrats flipped in 2006 came from districts that leaned Republican by at least five points at the presidential level two years earlier. In 2018, just over a quarter did. That difference matters. In 2006, Democrats won districts that had previously voted Republican by double digits. These were not districts that had already drifted left. They moved because voters made a broader judgment about governance. When partisan lean becomes less predictive, you are not watching a routine correction. You are watching something deeper. The 2018 midterms brought a meaningful wave. The Democratic Party picked up 41 seats and took control of the House. But most of those gains came in suburban and Clinton leaning districts. The shift was broad, but it did not cut as deeply into traditionally Republican territory as 2006. That distinction points to the underlying driver. 2018 reflected backlash within specific blocs of voters. 2006 reflected a broader erosion of confidence in governance. The environment developing in 2026 is structurally closer to 2006. The Economy and Approval MatterMidterms don’t unfold in isolation. They reflect how voters feel about the president and the direction of the country. In 2006, George W. Bush entered the fall with approval in the high 30s. In 2018, Donald Trump was in the low 40s. In both cycles, the midterm became a referendum. Today, presidential approval sits well below the comfort zone for an incumbent party. History is clear on this point. When approval drops into the 40s, the majority faces headwinds. When it slips toward the high 30s, those headwinds stiffen. The economy shapes how that judgment takes form. Voters don’t experience economic reports. They experience rent, insurance premiums, grocery bills, and whether public health feels stable and predictable. Growth on paper does not override daily strain. In the end, the questions are simple. Is governance working? Is the party in power delivering what it promised? When the answers begin to trend negative across multiple fronts, electoral movement follows. Retirements and an Expanding BattlefieldRetirements offer another signal. In 2006, 27 sitting House members did not seek reelection. In 2026, 51 representatives and one non-voting delegate have already announced they are stepping aside. Open seats are easier to flip. Incumbent advantage disappears. Donor networks shift. Voters are not anchored to a familiar name. When the majority party must defend a large number of open districts at once, the map becomes more volatile. If retirements continue at this pace, especially in competitive districts, the battlefield widens. And when the battlefield widens, resource pressure increases. Compete EverywhereOne of the clearest lessons from 2006 is that Democrats did not confine themselves to obvious battlegrounds. They competed in districts that were assumed to be safely Republican. That forced Republicans to defend more territory than expected. Campaign committees operate with limited dollars and limited time. If Democrats recruit credible candidates across the map, including in traditionally Republican districts, Republicans are forced to choose where to invest. Some incumbents will receive help. Others will not. That is how additional seats become vulnerable. A narrow majority is not defended comfortably. The more districts that require attention, the more fragile that defense becomes. If broader dissatisfaction is building, wide recruitment ensures it has somewhere to translate into votes. This is why for the past year I have been encouraging state parties to recruit candidates for every seat, regardless of partisan lean. The Senate ParallelIn 2006, Democrats did not just win the House. They defeated Republican incumbents in Missouri, Montana, Pennsylvania, Ohio, Rhode Island, and Virginia. They held open seats in Maryland and Minnesota. What began as a contained Senate map expanded as the cycle unfolded. The Senate landscape in 2026 is showing early signs of similar movement. There is a strong Democratic recruiting class. Competitive races are developing in North Carolina, Ohio, Maine, Alaska, Mississippi, and Iowa. Conversations are emerging in South Carolina, Florida, and Texas that would have seemed unlikely in calmer cycles. Not all of those races will break the same way, but that is not the point. When voters begin rendering a broader judgment on governance, Senate maps expand. And when they expand, the majority party faces the same constraint it faces in the House: finite resources and difficult defensive choices. The Bottom LineIn 2006, voters across different regions and political backgrounds reached a similar conclusion. Governance was not meeting the moment. When that perception takes hold, partisan lean becomes less reliable as a predictor. If the structural conditions developing in 2026 continue, the possibility of deeper map movement becomes real. History does not repeat neatly. But it does reveal patterns. And one pattern is consistent. When confidence in governance erodes across multiple fronts, the electoral map can shift in ways that surprise even seasoned observers. That was true in 2006. It may prove true again. You’re currently a free subscriber to Jaime’s Table. For the full experience, upgrade your subscription.
|
Sunday, February 22, 2026
The Road Back to a Majority, Part 2
Subscribe to:
Post Comments (Atom)
No comments:
Post a Comment